Monitoring data for Important Bird and Biodiversity Areas (IBAs) are currently available for around one-third of the world’s 12,000 IBAs. The message emerging is worrying: over half of these sites are assessed to be in a poor or very poor state and subject to high or very high pressures, while for two-thirds of them conservation responses are low or non-existent. A more detailed analysis of pressure data, provided in early 2013 by the BirdLife network for 115 countries and territories as well as the high seas, has identified a set of IBAs at extreme risk of losing their biodiversity value. The resulting list of 333 “IBAs in Danger” will be used to target enhanced conservation effort for these sites, through advocacy, campaigning and local action.

Since the IBA Programme began in the late 1970s, over 12,000 IBAs have been identified, mapped and documented worldwide. The focus of the programme has now moved to ensuring the long-term conservation of these sites and the key biodiversity they contain, guided by regular monitoring. At the national level, monitoring is essential to track and respond quickly to threats, to understand the status and trends of biodiversity and to assess the effectiveness of conservation efforts. A simple monitoring framework is being used across the BirdLife Partnership which allows these national data to be pooled and analysed regionally and globally, in order, among other things, to inform international conservation advocacy. The IBA monitoring framework provides a standardised way of scoring the threats to IBAs (‘Pressure’), the condition of IBAs (‘State’) and conservation actions taken at IBAs (‘Response’), each on a simple, four-point scale. Such a scoring system makes it possible to integrate a wide range of information, which, in order to take advantage of as many types and sources of data as possible, may often be qualitative rather than quantitative.
Some monitoring data are currently available for about one-third of IBAs; however, while not a complete picture, these sites are spread widely across all continents and biomes and are thus likely to be representative of the situation at all IBAs. Over half (53%) of the 2,681 sites whose State has been assessed are scored as being in a Poor or Very Poor condition (see Figure a), while the Pressures at a similar proportion of sites (56% of 3,946 sites) are rated as High or Very High. Conservation Responses at fully two-thirds of IBAs (67% of 3,183 sites) are considered Low or Negligible.
This disturbing picture is one of the reasons behind the “IBAs in Danger” initiative, which seeks to reinforce the conservation effort for those IBAs that are seriously threatened and poorly protected or managed. It is intended that this initiative will provide a focus for targeted campaigns and for wider advocacy and communications work, at national, regional and global levels, in order, wherever possible, to mitigate threats and improve protection, recognition and management of these sites.
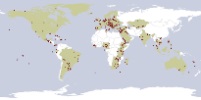
“IBAs in Danger” are sites identified nationally through IBA monitoring as being at greatest risk of losing their key biodiversity. They are therefore sites which have Very High threat scores (in some cases IBAs with High scores have also been considered). In the first trial of this new initiative, organisations in the BirdLife network provided details of up to five such sites per country. This limitation was imposed to restrict the list to a relatively small number of highest priority sites, in order to focus advocacy and action while ensuring participation and involvement across the BirdLife Partnership. As a result, the list of IBAs in Danger currently comprises 333 sites across 115 countries and territories as well as the high seas. Their locations are shown on Figure b the full list of sites is provided here. While it can be seen that some countries are in the fortunate position of having no sites with Very High threat scores, in others it is known that there are more IBAs at serious risk than are listed by this rapid assessment. Furthermore, since, as the map shows, data have not yet been assessed for countries outside the BirdLife network it is emphasised, that this list is not a complete one. The absence of an IBA from the list does not, therefore, mean that it is not facing any threats.

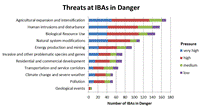
The sites that are on the list are affected by ten main threat types (terminology follows the IUCN / CMP standard threats classification: http://www.iucnredlist.org/technical-documents/classification-schemes/threats-classification-scheme). The threat which was scored most frequently as Very High, affecting over 50 sites (15%), was Agricultural Expansion and Intensification and it was the single most common threat overall, recorded at some 170 sites (see Figure c). Three other main types, Human Intrusions and Disturbance, Biological Resource Use (which includes logging, hunting and fishing) and Natural System Modifications (includes dams and other water management-related threats), were each scored as Very High threats at about 40 sites (12%). The graph also clearly shows that the total number of threats recorded well exceeds the number of sites, demonstrating that many IBAs suffer serious pressure from multiple threats.

Related Case Studies in other sections
Links
IBAs in Danger initiative leaflet
BirdLife IBA monitoring framework
Compiled: 2013
Recommended Citation:
BirdLife International (2013)
Many IBAs are in danger of losing their natural habitats and key biodiversity.
Downloaded from https://datazone.birdlife.org/many-ibas-are-in-danger-of-losing-their-natural-habitats-and-key-biodiversity on 22/12/2024